.svg)
 2 minutes reading time
A heatmap (or heat map) is a visual overlay that helps you track your website visitor's activity. It's a great way to get an overview of how your visitors are behaving as they navigate your site. You'll learn why visitors are leaving and where they get frustrated. When you're on a mission to improve your conversion rates, heatmaps can be used in your decision-making -- as long as you know what you're looking for. That's where this post can help you.
Most heat maps are created by using click-tracking software that translates where a user places the cursor and presses the mouse button into a 2-dimensional color-coded visual. Some popular companies that provide heatmaps are vwo, crazyegg, mouseflow and hotjar.
Different Types of Heatmaps
Let's take a look at the three different types of heatmaps currently available and how they can be used to increase conversions.
Click and Tap Heatmaps
These heatmaps show where visitors click their cursor on desktop devices and where visitors are tapping on mobile and tablet devices.
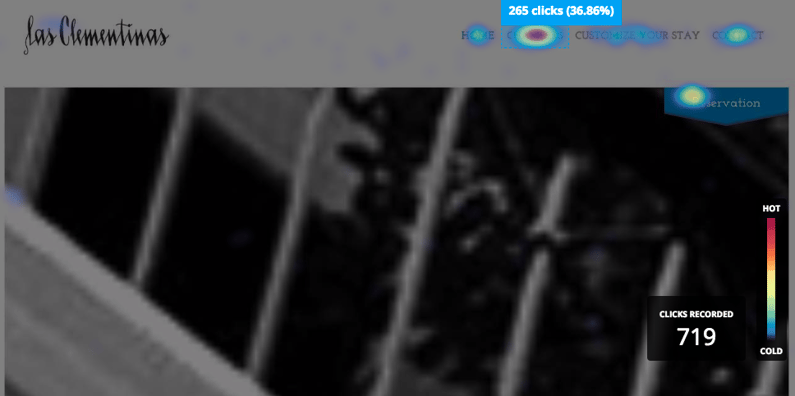
How to use?
Click and tap heatmaps can be used for several kinds of tests. In the example above we used the heatmap to discover which links and call-to-actions are being clicked on the homepage of Las Clementinas hotel. We learned that ‘Chambers’ is the most clicked link, followed by ‘Contact’ and ‘Reservation’. As we knew Chambers is important, we made sure it’s the first thing the visitors see right below the fold. We also added a live chat function to make it easier for visitors to ask questions.
Move Heatmaps
Only available on desktop – move heatmaps show where visitors move their mouse on the screen. This provides a good representation of where the visitor is looking on the page.
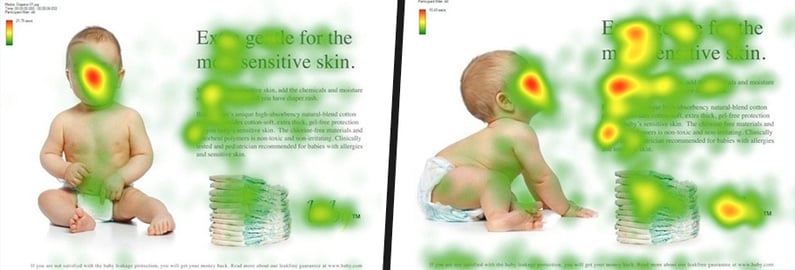
How to use?
You want your users to focus on specific areas on your website such as your value proposition and call-to-actions. With move heatmaps you get a good indication of where your users are looking. In this A/B test, picture A (left) shows a baby looking towards us, making us focus mainly on the baby’s face. In picture B (right) the baby is looking towards the text, shifting the focus entirely towards what’s important!
Scroll Heatmaps
Shows you to what position your visitors are scrolling on a page. It includes the precise % of visitors that see a particular vertical position.
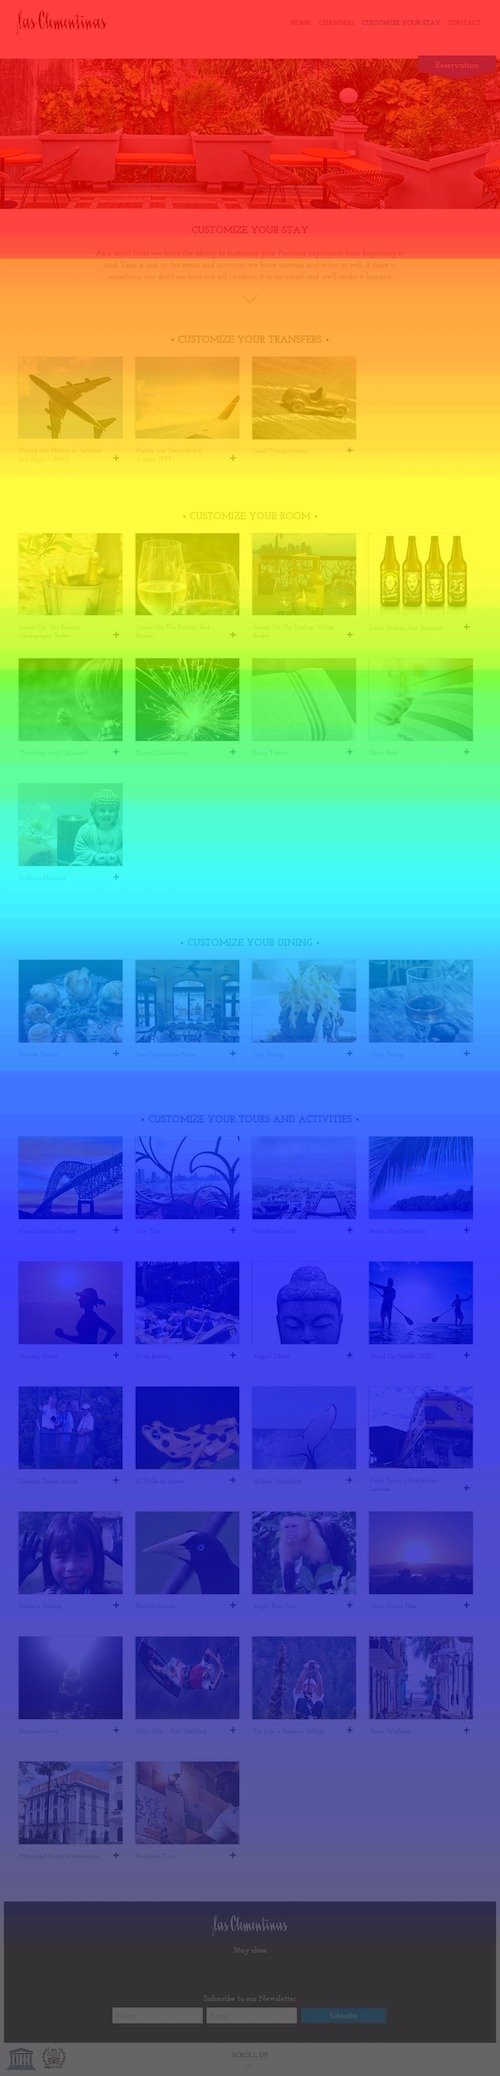
How to use?
Scroll heatmaps give you insights into where website users are losing attention and stop scrolling down. In the example above hotel guests can select additions to their stay. We can see it’s essential to have your best offers first. We couldn't give you a screenshot showing percentages, but we found that less than 40% of this page's visitors scroll below the green area! That means that only a small percentage knows about the dining, tours and activities options on offer.
To explore more tests you could do with heatmaps, check out this overview.
If you're already a user of Google Analytics, heatmaps will be a great addition to start making data-driven decisions to improve your website conversion rate.
This article is part of the Growth Blueprint Blog Series. The Growth Blueprint provides companies with a comprehensive strategy to increase leads and grow their business online.
Setting up heatmaps is a key part of the complete foundation for a successful website. Do you want to know if the Growth Blueprint can help your business grow online? Contact us today.